One market. Two ways to see it. One way to hear it.
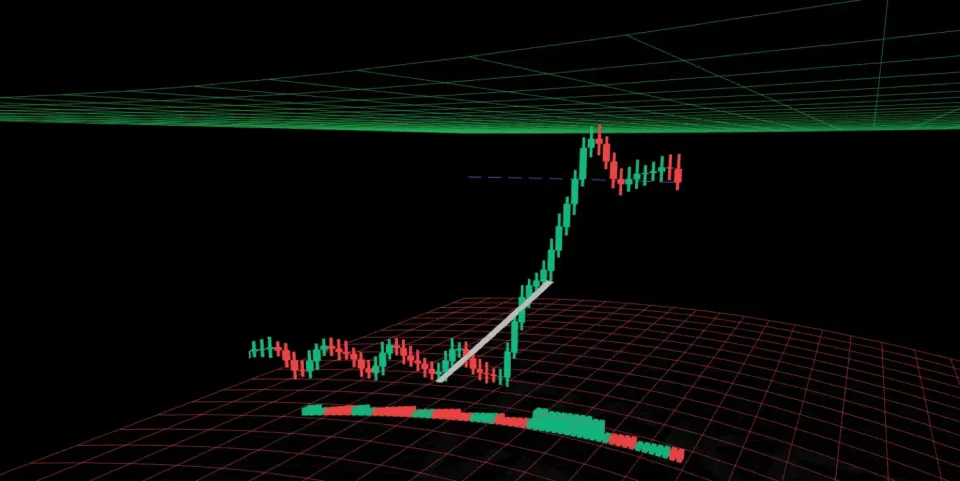
Tickerverse is a live crypto terminal with a 2D chart for analysis, a 3D view for exploring, and Audicators that turn market activity into music. The three stay in sync, so you can work the way that suits you and switch whenever you like.
Analyze in 2D. Explore the same chart in 3D.
The 2D chart is where you focus: candles, indicators and drawing tools that work the way you expect. The 3D view shows the same data with depth. Scroll or zoom one and the other follows, so you never lose your place.
- Draw a trendline, zone or Fibonacci in 2D and it appears in 3D, where you can give it depth or turn it into a 3D form
- Indicators that follow price stay locked to the candles; others can sit on their own plane in depth
- Prefer flat? Use the 2D chart on its own, full screen
- Pro: put the 2D chart in its own window on a second screen, linked live to 3D
Hear the market change before you look.
An Audicator plays music driven by the live market. You can leave it on while you work and only look up when something sounds different. Sound alerts can fire on what it hears: a volume surge, a big candle, or the music entering a new section, while a Tickerverse tab is open.
More on market sonificationThe music gets fuller as the market turns volatile and settles as it calms.
Outsized candles and volume spikes get their own sound.
Calm, Normal or Twitchy. A limiter keeps it comfortable.
A listening log shows why every sound fired.
Free accounts get four Audicators, including Target Price Sonar and Directional Ticks. Pro adds 20+ musical themes, from ambient to house.
Price, volume and indicators, each at its own depth.
In 3D, price, volume and indicators sit on their own planes, so studies sit beside price instead of piled on top of it. Two Pro chart types put volume into the candles themselves.
- 3D Volume Spikes: a spike out of each candle, longer the more volume traded in it (Pro)
- 3D Volume Depth: each candle as thick as its volume (Pro)
The bigger timeframes, right behind your chart.
Stack other timeframes in 3D behind your chart, lined up in time, each with its own indicators. What-if indicators run ahead of the last candle to show where they go if price stays flat.
- Any timeframe from 1 second to 1 month, one layer each
- Indicators on each layer, from that layer's own candles
- What-if: up to 100 bars ahead with price held at the last close; not a forecast
Play a past stretch of the market back, with its sound.
Pick a date and time, or one of the biggest moves of the last 24 hours or 7 days, and play 15 minutes to 2 hours of it back second by second at 1x, 5x, 10x or 30x. The Audicator plays along.
- 1-second candles show the bursts and pauses inside a minute (Pro)
- Practise reading a move without waiting for the market to repeat it
Point and figure, linked to the candles that made it.
A live point and figure chart beside the 2D or 3D chart: X's while price rises, O's while it falls, no time axis. Point at a box and the candles that made it light up on the chart.
- Automatic box size from recent range, or type your own
- Reversal of 1, 2, 3 or 5 boxes; high-low or close
- Pops out to its own window, still linked to the main chart
Draw once. Spread out over two screens.
Trendlines, rays, zones, Fibonacci levels, channels and long and short positions work in 2D and in 3D. Open the 2D chart, watchlist, ticks, room, alerts or the Listen stage in their own windows, linked live to the main chart.
- A drawing made in 2D is in 3D too, where it can take depth or become a 3D form
- Change the ticker in one window and the others follow
Switch how you look at the market.
3D
The chart with depth. Orbit it, give drawings depth, and set indicators on their own planes.
2D Chart
A familiar chart with indicators and drawing tools, full screen. A good place to start.
Point & Figure Pro
Columns of X and O boxes that only move on a whole box. Point at a box to light up the candles that made it.
Replay Pro
A past stretch of the market, played back second by second with its sound.
Markets
Every crypto pair on one page: search, filter by category and sort by price, change or volume.
Heat Map
The whole market as tiles: size is volume, colour is the 24h change.
Heat Map 3D
The market as bars, or as people walking to the busiest markets.
Listen
The Audicator library on its own: pick one, pick a market, and leave it playing.
Put the chart somewhere.
Behind the 3D chart sits an environment, from a plain grid to a rainy studio. Some of them move with the market: they get busier when trading picks up and calmer when it slows.
- Free: 5 environments
- Pro: 16 more, 8 of them move with the market (below)
Made for the screen beside you.
Zen mode hides the controls so the chart and its sound can run on a second monitor all day. It can also cycle through your watchlist on its own.
- Live crypto prices, updated every second; stocks are coming later
- Runs in the browser on desktop, and works on phones and tablets
- Rooms and chat for each market
The Pro environments that move with the market or the chart
The Grid A floor grid running back to wireframe mountains. Each second of trading lights a line that runs along the floor: green when price ticked up, red when it ticked down, longer and brighter the more volume traded.
Ridgelines Stacked contour lines below the chart, flowing toward you. The peaks rise as the market gets more volatile and settle as it calms.
Colonnade Two rows of outlined pillars moving slowly past the chart. The beam overhead tints green when price ticks up and red when it ticks down.
Deep Field Three layers of stars drifting toward you. The more volume the market trades, the faster they drift.
Daylight The sky follows the time you are looking at: scroll back through history and the sun and moon move across it, in the chart's timezone. Day runs 06:00 to 18:00.
Digital Rain Each second of trading sends rain down behind the chart onto a dark glass floor: green when price ticked up, red when it ticked down, heavier when more volume traded. Each drop keeps its colour all the way down.
Platformer A side-scrolling world under the chart that moves as you scroll through history, each layer at its own speed. A small runner near the live edge hops when price ticks up.
Order Book Brawl Each up-tick sends a green bull onto the grid and each down-tick a red bear, bigger when more volume traded. They fight, and the first side with 24 standing wins the round. The rounds are a game, not a market signal.
Grid Traffic Up-ticks drive green vehicles along the grid and down-ticks drive red ones across it: motorcycles for quiet seconds, sedans for typical ones, semis for the busiest. Where they cross, they yield.
Trading Floor Plaza Each person on the floor is someone watching this chart right now, up to 48. They walk in as people join and leave as they go; when price ticks up some cheer, when it ticks down some check their tablets.
Questions
- Do I need to know 3D to use it?
- No. The 2D chart works on its own, and the 3D view follows it. Many people start in 2D and turn to 3D when they want to look at something from another angle.
- What markets does it cover?
- Crypto pairs in US dollars, with live prices. Stocks are planned for later.
- Will the sound get annoying?
- It is music, in key, through a limiter, with Calm, Normal and Twitchy settings. You can change the theme, turn the volume down, or switch the sound off and keep the visuals.
- What is in the free plan?
- The 3D view and the 2D chart, 4 Audicators, 4 scene presets, 5 environments, rooms and chat, an unlimited watchlist, up to 5 indicators at once and 1 active price alert. Pro adds drawing tools, timeframe layers, Replay, Point & Figure, the linked 2D window, more Audicators and environments, and more. See pricing for the full list.
- What do I need to run it?
- A modern browser. A desktop or laptop is best for the 3D view; phones and tablets work too.
- Is this trading advice?
- No. Tickerverse shows and plays market data. It does not place trades or tell you what to buy or sell.
See it, then hear it.
Early access for Pro opens October 23, 2026. Everyone else on December 1, 2026.
Tickerverse is a market visualization and sound tool. Nothing here is investment advice.